How we score Blog Advertise
  1. opendesign.foundation
  2. Spec guide
  3. DCI-P3 coverage
Colour

DCI-P3 coverage: typical values for displays & pen tablets

Half of displays & pen tablets in the catalog have DCI-P3 coverage below 98%, and 80% fall between 90% and 99% (142 models with data).

Median98%
Median 202698%
Typical range90% – 99%
Models142
Distribution

How DCI-P3 coverage is distributed

013253850838594969899.199.810083: 284: 185: 790: 894: 295: 2596: 297: 1198: 5099: 3099.1: 199.5: 199.8: 1100: 1Median 98%
Percentile10 %25 %50 %75 %90 %
DCI-P3 coverage90%95%98%98%99%

A model at the 75th percentile beats three quarters of the catalog on this spec.

Trends

Median DCI-P3 coverage by year

0%30%60%90%120%2020202120222023202420252026
Recent leaders

Highest DCI-P3 coverage

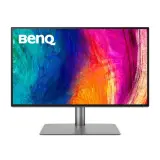
1 BenQ PD2725U
BenQ · 2023
PD2725U
27″3840 × 216065 W100%
100%
6.9
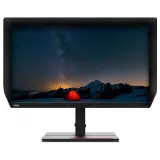
2 Lenovo ThinkVision P27u-20
Lenovo · 2022
ThinkVision P27u-20
27″3840 × 216099.5%99.1%
99%
9.0
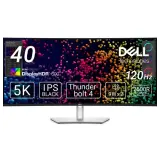
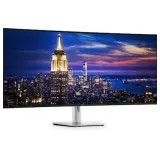
3 Dell UltraSharp U4025QW
Dell · 2024
UltraSharp U4025QW
40″5120 × 2160140 W99%
99%
9.0
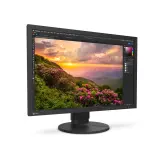
4 EIZO ColorEdge CS2400S
EIZO · 2023
ColorEdge CS2400S
24.1″1920 × 120099%70 W
99%
7.1
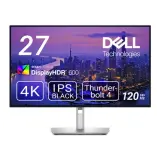
5 Dell UltraSharp U2725QE
Dell · 2025
UltraSharp U2725QE
27″3840 × 2160140 W99%
99%
9.6
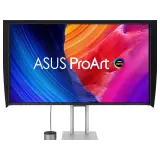
6 Asus ProArt PA32UCDMR
Asus · 2026
ProArt PA32UCDMR
31.5″3840 × 216096 W99%
99%
9.3
7 Asus ProArt PA32DC
Asus · 2022
ProArt PA32DC
31.5″3840 × 216099%65 W
99%
7.8
8 Dell UltraSharp U5226KW
Dell · 2026
UltraSharp U5226KW
51.5″6144 × 2560140 W99%
99%
8.2
9 Asus ProArt PA27JCV
Asus · 2025
ProArt PA27JCV
27″5120 × 288095%96 W
99%
8.6
10 LG UltraFine 40U990A
LG · 2025
UltraFine 40U990A
39.7″5120 × 216096 W99%
99%
7.7
To compare: 0up to 4 models
Compare