How we score Blog Advertise
  1. opendesign.foundation
  2. Charts
  3. Pixel density vs screen size
Charts

Pixel density vs screen size

227 models since 2020 on one chart: each dot is a model. The dashed line is the median pixel density for a given screen size.

Axes run from the 1st to the 99th percentile; extreme values are left off the chart.

Stand-outs
Most pixel density for their screen size

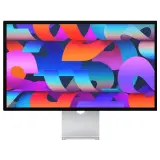
1 Apple Studio Display (2026)
Apple · 2026
Studio Display (2026)
27″5120 × 288096 W
218 ppi27″
9.6
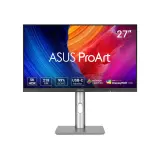
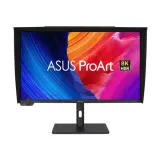
2 Asus ProArt PA27JCV
Asus · 2025
ProArt PA27JCV
27″5120 × 288095%96 W
218 ppi27″
8.6
3 BenQ MA270S
BenQ · 2026
MA270S
27″5120 × 288096 W99%
218 ppi27″
9.3
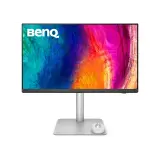
4 BenQ PD2730S
BenQ · 2025
PD2730S
27″5120 × 288090 W98%
218 ppi27″
9.2
5 Apple Studio Display XDR
Apple · 2026
Studio Display XDR
27″5120 × 288096 W
218 ppi27″
9.7
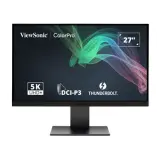
6 ViewSonic VP2788-5K
ViewSonic · 2026
VP2788-5K
27″5120 × 288088%15 W
218 ppi27″
7.3
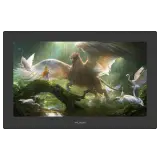
7 Huion Kamvas Pro 16 4K
Huion · 2026
Kamvas Pro 16 4K
15.6″3840 × 21608,192345.6 × 194.4 mm
282 ppi15.6″
8.6
8 Asus ProArt PA32KCX
Asus · 2026
ProArt PA32KCX
32″7680 × 432095%96 W
275 ppi32″
7.2
To compare: 0up to 4 models
Compare